We have often been asked to explain what we do at Teranalytics: what does it mean “data analytics applied to business decisions”. How much of that is machine learning, and how much is strategy? What are the steps involved?
The answer, of course, depends on many factors: the problem, the data, the stakeholders, the industry, etc. We will devote separate discussions to each case as time goes on but in the search for a clear and unifying answer, we have adapted the five pillars of the SMART framework (ref: “Big Data: Using SMART Big Data, Analytics and Metrics To Make Better Decisions and Improve Performance” by Bernard Marr) to consulting in data analytics.
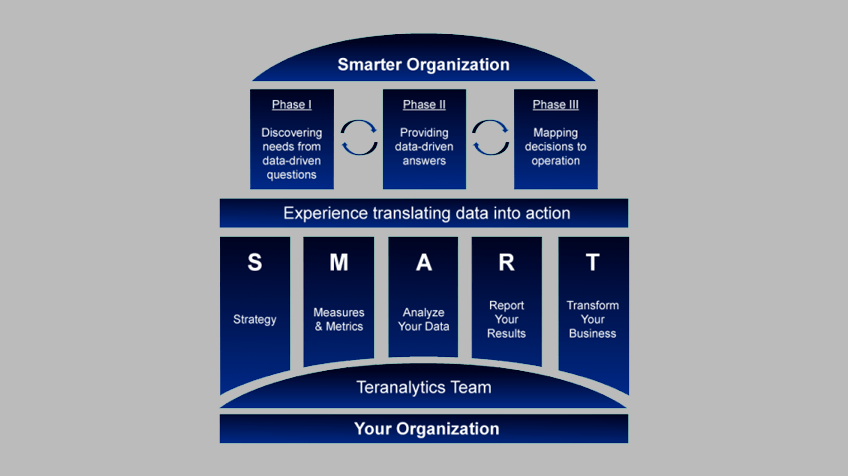
Our adaptation is shown in Figure 1, clearly laying out the pathway toward successfully applying data analytics to organization:
- Strategy: in other words, what do you want to achieve? What is your goal?
o This phase is our situation analysis: What have you tried? What has worked, not worked? Who is involved? What is your timeline? What are the constraints? During this phase, we work closely with our clients to clarify the problem to be addressed. - Measures and Metrics: as it is well known, what is not measured cannot be improved.
o This second step includes ETL (Extract-Transfer-Load), data cleansing, quality & consistency control, and data completion. As much as we love data analytics and its impact, this step is one of the most important one – and most time consuming. Since we want to be seamless and not disrupt the companies’ processes in place, we are able to accept whatever data format companies have: noSQL, SQL, Excel, etc, and even plain text.
o For example, one of our client once gave us thousands of small text files which included sequences of numbers and codes: these were the output of their sensors. Our first step was to parse everything and create a database structure in order to then run our data analytics. - Analyze: what are the data telling us?
o This is one aspect of our core expertise. We resort to a variety of machine learning algorithms, supervised and unsupervised, as well as statistical descriptive and predictive approaches. - Report your Results: what are the main finding?
o This step might sound straightforward. It is not. The purpose is not to provide a download of “observation/trends/findings” (for example a confusion matrix, or a final saving dollar amount) but to frame the insights in the clearest and most impactful manner. Reporting results that can be understood in seconds, and continuously appreciated the more people look at them, is an art that we have developed through years of practice, and which is greatly appreciated by our customers. - Transform your business: what are the next steps?
o The last step of the framework focuses on supporting the implementation of the business solutions identified. We do not simply deliver a working interface with output predictions, but we work closely with our clients in supporting the integration of our findings into their operation. This can involve working with the client’s IT team to scale our solutions, packaging our work for investor and industry conference presentations, or simply providing continuous support to ensure the smoothest possible transition.
The proper implementation of the five pillars of the SMART network requires a very diverse set of skills: managerial, data science, data visualization, C-suite expertise, and powerful presentations. We like to remind our customers that consulting in data analytics is not just about running algorithms: it is about flawlessly and simultaneously mastering these five pillars in order to apply them to specific problems. With this foundation in place, we are then ready to move up the chart in Figure 1 and support the next step: executing on three phases where the five pillars meet our customers expectations.